Australia

William Buckโ€™s Mergers and Acquisitions (M&A) and Venture Capital (VC) Report 2021 is based on extensive research into M&A activity in Australia over the last 14 years, from January 2007 (prior to the Global Financial Crisis) to December 2020 and VC activity from 2019-2021. The report evaluates findings to inform our expectations of future M&A and VC activity. We also consider the current IPO market.

Weโ€™ve paid special attention to the years 2009 and 2020ย whichย displayed interesting similarities including a spike in the number and value of deals.ย These two years, 2009 and 2020, were also yearsย during whichย Australia was feeling the impact of major economic crisesย in the Global Financial Crisisย (2007-2009)ย and COVID-19ย (2020-ongoing)ย respectively.

M&A Insights include:

  • Appetite for deal making has increased in the first half of 2021, particularly for higher value transactions of above $1 billion.
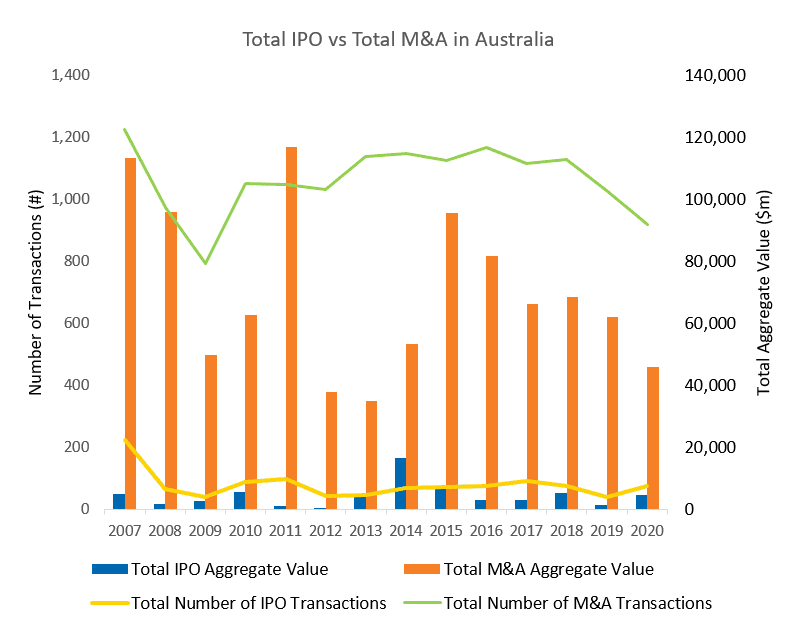
  • In the difficult years of 2009 (post-GFC) and 2020 (COVID19), there was a strong decline in the number and aggregate value of M&A transactions.
  • During the same years, smaller deals under $5m accounted for 50-52% of transactions. This is 10% above the average of 41% average over the 14-year period.
  • While over the 14-year period between 2007-2014:
    • Transactions under $100m made up around 87% of all transactions, with those under $10m accounting for the majority, averaging 54%, those between $10-$50m averaging 26% and those between $50-100m averaging 7%.
    • For middle market M&A, IT and Healthcare saw the most year-on-year growth in aggregate transactions.
    • Foreign buyers accounted for 24% of the aggregate volume and 30% of the aggregate value of middle-market M&A transactions.

VC Insights include:

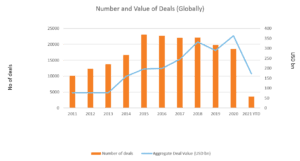
  • Globally, 2020 saw the highest aggregate VC deal over the last decade at $US363bn.
  • At home, we also saw the highest total deal value in a decade at $US2.7bn.
  • IT has been the top performing sector, accounting for 45-50% of all VC deals in Australia over the last decade.

1. Current deal trends – post-crisis deal resurgence

2. 2009 and 2020 M&A transaction trends

3. M&A trends from 2007 to 2020

4. Best performing sectors

5. Venture Capital trends from 2019 to 2021

6. Current trends in the IPO market

1. Current deal trends – post-crisis deal resurgence

Whatโ€™s behind the current deal making resurgence?

Asย Australiaย began to emerge from the pandemic this year, we saw appetite for deal making increase, a trend which we expect to see into 2022 at the least, with a double dip recession unlikely despite a recent return to lockdowns.

Many factors are coinciding to drive a resurgence of deal making activity. These include lower interest rates and higher business optimism, delayed deals being revisited, and companies pivoting to accelerate growth through the acquisition of new businesses or strategic mergers.

In addition, throughout the 2020 recession, Coronavirus offered a unique opportunity for certain industries, such as technology and healthcare, to thrive. These sectors, which became paramount to economic recovery, are now leading the resurgence of deal making and hence account for a large portion of the transactions weโ€™re seeing.

Timing of deals

The timing of deals was generally extended during the pandemic, with each stage of a transaction taking longer to accomplish. This was due to diminished staff levels, lockdowns, new risk factors to account for (including measuring the sustainability of performance before, during and after the pandemic), new due diligence considerations and competing priorities within businesses. A lot of these deals are now being revisited and fast-tracked.

Pivoting to thrive post-pandemic

Many companies have been quick to respond by repositioning themselves to thrive post-pandemic. Some are choosing to acquire new businesses to improve supply chains, undertake strategic mergers or pivot in terms of product and service offering or create the need for deal-making to improve their capabilities. While others are looking to make acquisitions due to the challenge posed by organically growing their business to justify market valuations.

Lower interest rates and business optimism

In Australia, an expected increase in deal making might also be testament to lower interest rates, which the RBA doesnโ€™t expect to see lifted until 2024, generous government stimulus and a higher AUD/USD exchange rate.

Rapidly growing business optimism also has a role to play, with NABโ€™s Business Confidence index demonstrating that throughout 2020, sentiment was at -66% and is now sitting at around +10%. This is reflective of trends in 2009, where sentiment plummeted to -32%, and then rapidly increasing to almost 18 index points in September 2009.

2. 2009 and 2020 M&A transaction trends

In the difficult years of 2009 and 2020 there was a significant decline in both the number and aggregate value of M&A transactions in Australia. In 2009 aggregate value fell by 48% while in 2020 aggregate value fell by 26%.

During the GFC in 2009 and COVID-19 in 2020, smaller transactions under $5m took prominence:

  • In 2009, deals under $5m accounted for 50% of all transactions – 10% above average, and
  • In 2020, these transactions made up 52% of transactions – a whopping 41% over the average.

This is in comparison to transactions between $10m – $50m making up 26% of all transactions over the entire 2007-2020 period.

Insights

When theย economy goes through a tough period, initially, people look to make smaller bolt-on acquisitions rather than take the risk involved in making larger acquisitions.ย 

These trends highlight risk-averse behaviour and follow those in consumer and business confidence. If the size of transactions lift as consumer and business confidence have, we can expect mid-market M&A to experience a strong uplift alongside economic recovery.ย 

This is evidence thatย coronavirus has had little impact on thisย mid-market, which is a resilient sector.ย ย 

Further evidence can be seen in the volatility that exists in the number of transactions in the $5m – $10m category across the same period.ย ย 

There is an increase in the number of higher value transactions, and therefore a decrease in those with a lower value, when economic conditions are strongย ย 

Itโ€™s interesting to note that in the first half of calendar 2021 the number of deals announced increased sharply by more than 2.5 times the average over the last 5 years, with many of these deals being mega (listed company) deals with a value more than $1 billion.ย 

While there is a strong correlation between total and mid-market M&A, fluctuations in mid-market M&A are less significant due to the mid-market being less susceptible to economic volatility.ย 

3. M&A trends from 2007 to 2020

William Buckโ€™s study of the Australian M&A market from 2007 to 2014 shows whilst there have been big swings in the number and value of large or mega size transactions, the trends in mid- market deals under $100 million have been very consistent over the last 14 years.

Overall, transactions under $100m in value made up on average 87% of the total number of transactions over this period.

  • Smaller M&A transactions with a value under $10m made up the majority of transactions, averaging 54%.
  • Deals with a value between $10m to $50m made up 26% on average.
  • Deals with a value of between $50m to $100m made up on average 7%.

Sector performance

Sectors which accounted for the largest portions of Australiaโ€™s mid-market aggregate M&A transaction value over the last 14 years include: Consumer Discretionary (including automotive, retailing and apparel) (21.9%), Industrials (including transport and toll road operators) (18.7%) and Materials (including chemicals and construction materials) (12%). Together, these sectors accounted for over 52% of Australiaโ€™s mid-market aggregate M&A transaction value from 2007 to 2020. ย 

Information technology (IT), healthcare, materials and utilities were the sectors that saw the most year-on-year growth in their aggregate transaction values in the middle market from 2007 to 2020 – see more on best performing sectors.

Insights

We expect this trend will continue due to the digital transformation thatโ€™s occurred in response to COVID-19 and the emergence and adoption of artificial intelligence, blockchain and other technologies. We have also seen a tremendous increase in investment by VCโ€™s in technology companies over the last 3 years as confidence in the sector and adoption rates has increased (VC trends are discussed later in thei report).

The healthcare sector is forecast for an annualised 2% growth over the next five years, we expect healthcare to account for more of the total aggregate transaction value each year in Australia.ย 

Buyers

Foreign acquirers account for 24% of the aggregate volume and 30% of the aggregate value of Australian middle-market M&A transactions. Trends demonstrate that foreign buyers consistently participate in middle market transactions, especially larger value deals which justify the effort from foreign buyers.

The average EBITDA multiple remained relatively consistent between local and foreign acquirers from 2007 to 2020, except for 2008ย during the GFC and 2020 during COVID-19. During these periods, foreign acquirers paid higher average multiples.ย ย 

From 2007 to 2019, unsurprisingly, the US and UK were the two largest foreign investors into Australia, accounting for 48% and 43% of foreign investments respectively. Thereโ€™s been a marked increase in investment from many East Asian countries including China, Japan and Hong Kong, corresponding with the emergence and integration of many of the Asian economies into the global economy. However, in recent years investment by these Asian countries has slowed down considerably.

Insights

While the proportion of local buyers sits at around 76% reasonably consistently over the 14-year period that weโ€™ve undertaken this study, trends demonstrate that the proportion of local buyers increases in periods of economic uplift with strong exchange rates, optimistic business sentiment and GDP growth.ย ย 

Thatย foreign buyers areย participating in larger value transactions doesnโ€™t mean that they are paying a premium for their acquisitions but supports the notion that to achieve the growth, synergies and scale which they require, they buy larger businesses.ย 

Foreign investors will exert more interest in the Australian market during a global downfall as we tend to remain relatively stable as an economy. This means thereโ€™s higher interest in getting into the market, and investors will pay more.ย This is particularly evident today with a raft of foreign buyersย looking to acquire Australian companies.

4. Best performing sectors

Information Technology

M&A

Information Technology (IT), defined as companies that serve the electronics and computer industries or that manufacture products based on the latest applied science, was the sector that saw the most growth year-on-year from 2007 to 2020 and has accounted for an average of 6.68% of the aggregate transaction value within the total Australian M&A market.

The average EBITDA multiple for IT M&A transactions in the total Australian market was 9.2x in 2020 and ranged between 6.5x and 10.5x over the last five years.

Importantly, IT was the only sector that demonstrated an increase in the number of transactions (3.6%) during 2020 amidst COVID-19, reflective of the update in digitisation that occurred in response to the pandemic.

We expect this trend to continue as businesses and workers leverage digital technologies to adapt to the ‘new normal’, with key industry drivers to include:

  • Digitisation and automation of business
  • Remote working and cloud-based solutions
  • Online education and E-Learning

Venture Capital

In Australian VC, IT has seen the highest number of deals over the last decade, sitting at between 45-50% of the total number of deals each year, including last year where it accounted for 45% of total deal numbers with 86 deals.

IT was also the leading industry by deal value, with total value of US$0.7bn. This is excluding Judo Bankโ€™s capital raising of US$869m, which is considered as part of the Financial and Insurance Services sector.

Healthcare

Healthcare, including MedTech and BioTech, has been a high performing sector for Australian M&A, achieving the second highest growth rate of all industries year-on-year over the last 14 years from 2007 to 2020, after Information Technology.

The Healthcare sector covers a diverse range of industries including companies involved in providing:

  • Medical products and services
  • Healthcare products and services
  • Medical technology and equipment
  • Aged care
  • Pharmaceuticals
  • Biotechnology, and
  • Life sciences.

M&A highlights across the healthcare sector include:

  • An increase in the aggregate M&A transaction value (for middle market transactions) in seven of the past 14 calendar years, highlighting increased activity in transactions under $100 million, and
  • Peak aggregate values of $804 million in 2008 and $979 million in 2015.

Accounting for an average of 5.56% of the total aggregate transaction value within the Australian M&A market across this period, the sector has proven to be key to the Australian market and one which is expected to see further growth in the wake of the pandemic.

Insights

Significant regulatory changes and changes to the way services are provided will likely mean that smaller independent practitioners without equity backing could struggle to adapt. Businesses will seek out capabilities with an increased uptake of digitisation and new care models (telehealth, telemedicine and innovative homecare), which could lead to increased M&A activity.

Meanwhile, the industry in Australia is already forecast for an annualised 2% growth over the next five years due to the ever-rising aging population in Australia. The number of individuals aged 50 or older is expected to increase as the baby boomer cohort ages. This is likely to increase demand for health services, with people aged 65 and over are expected to account for over 30% of health services revenue, despite only making up around 15% of the population.

5. Venture Capital trends from 2019 to 2021

Global trends

Globally, 2020 saw the highest aggregate Venture Capital deal value over the last decade, sitting at US$363 billionย โ€“ 25.5% above that in 2019. This isย despite the number of deals dropping slightly, by around 6.5%.ย ย 

The size of deals increased, with the average sitting at US$8.5m in 2020, and US$7.6m in 2019.ย ย 

Trade sale has been the most popular exit strategy for venture capital deals over the last decade with trade sales accounting for two thirds of exit strategies. This remains the case.

Trends at home

Like VC globally, in 2020, Australia had the highest total deal value at $US2.7 billion. – a 59% increase on the total deal value in 2019. This is despite the number of deals dropping by 13%.ย 

VC investors have consistently shown to demand high rates of return (28%-38%) in comparison to other investor types such as senior lenders, asset-based lenders, mezzanine funds, etc.ย ย 

In Australian VC, IT had the highest number of deals in 2020 at 45% of all deals. This is consistent over the past decade with IT accounting for 45-50% of the number of VC deals.ย ย 

Insights

William Buckย expects the IT sector to grow, with investment in the space having matured. Thereโ€™s been a number of really good and proven investments in the space, globally and in Australia.ย ย 

The marketย hasย developedย as hasย investorsย appetite for risk in this emerging space, and tech has developed with products such as artificial intelligence and cyber security.ย 

Importantly, thereโ€™s more trust in the sector supported by more referenced examples of positive VC outcomes in Australia like Canva and people are starting to relate to the sector better.

6. Current trends in the IPO market

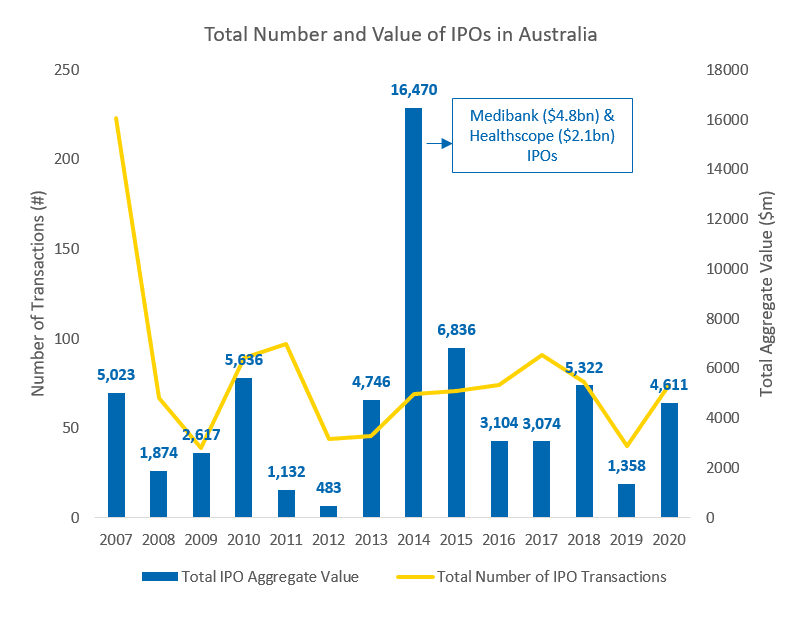
Last year, the Australian IPO market underwent marked growth of 85% in aggregate volume and an enormous 240% in value over 2019, despite, or potentially somewhat due to the implications of the pandemic.ย 

Insights

The growth in IPO has continued into 2021 and we expect it to continue into 2022 because of the higher volume of money looking for a return, and investors chasing higher returns than what they would see by keeping their money in banks.ย 

Equity markets are expected to continue to trade at higher valuations due to monetary and fiscal stimulus introduced in 2020. As a result, we can expect to see private companies wanting to go public, raising capital at higher valuations to realise expansion opportunities.ย