
There has been much discussion recently around whether we are in another tech “bubble”. Unlike traditional businesses, which tend to be valued based on multiples of their profit, technology companies are generally being valued based on multiples of their revenue. For example, at 31 March 2021, Afterpay was trading at a value that equates to more than 40 times its last twelve-month revenue levels.
There can be no doubt that the high valuations are being driven by strong growth expectations for technology businesses, which at least in theory, have the ability to scale quickly at relatively low cost.
The pandemic has forced governments to impose lockdown restrictions worldwide. Technology was on the rise before the pandemic. COVID-19 merely accelerated our adoption of it.
The question is, do these growth expectations support the current valuations of technology businesses?
Valuations comparison – from 2000 to 2021
At 31 March 2021, there were more than 1,100 companies in the information technology, communication services and heath care technology industries trading on the major US exchanges and the ASX where sufficient information was available to derive trading multiples (“Sector”). The median enterprise value (“EV”) of these companies was approximately $1.5 billion and the median enterprise value / revenue (“EV/R”) multiple was 4.5x.
For comparative purposes, let’s look back to March 2000 and the peak of the tech bubble. At 10 March 2000, there were 360 companies in the Sector. At this time, the median EV of these companies was approximately $1.3 billion and the median EV/R multiple was 4.8x. Not too dissimilar from where the trading multiples sit today. Let’s dig a little deeper.
Of the top 20 US tech companies with the highest EVs at 10 March 2000, only six of them remained on the top 20 list 21 years later at 31 March 2021: Microsoft, AT&T, Disney, Verizon, Intel and Oracle. Microsoft held second spot on the list at the height of the tech bubble and was able to maintain that position to hold it at 31 March 2021.
The EV/R multiples of the top 20 US tech companies with the highest EVs at 10 March 2000 were much higher at the peak of the tech boom compared to both:
- Their EV/R multiples at 31 March 2021; and
- The EV/R multiples of the top 20 US tech companies with the highest EVs at 31 March 2021.
Many of the tech companies that were prominent in 2000 did not have sustainable competitive advantages to maintain their positions as leaders in the Sector, allowing other companies to take their place. This is reflected in the median EV/R multiple of these companies (top 20 on 10 March 2000), which is currently 3.4x and is lower than the median EV/R multiple of the entire Sector at 31 March 2021 of 4.4x.
As the total number of companies in the Sector (US only) has almost tripled between 10 March 2000 and 31 March 2021, one does wonder how many of these companies have competitive advantages that will assist them to sustain their revenue growth rates and market positions in the longer term.
| US Technology companies | 10/03/2000 | 31/03/2021 |
| Number of companies | 331 | 927 |
| Median enterprise value ($AUDm) | $1,729 | $2,709 |
| Median EV / LTM revenue multiple (x) | 4.8x | 4.3x |
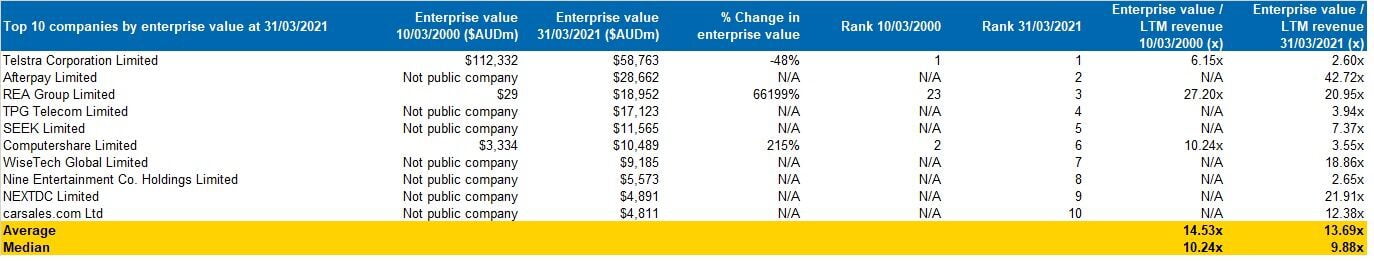
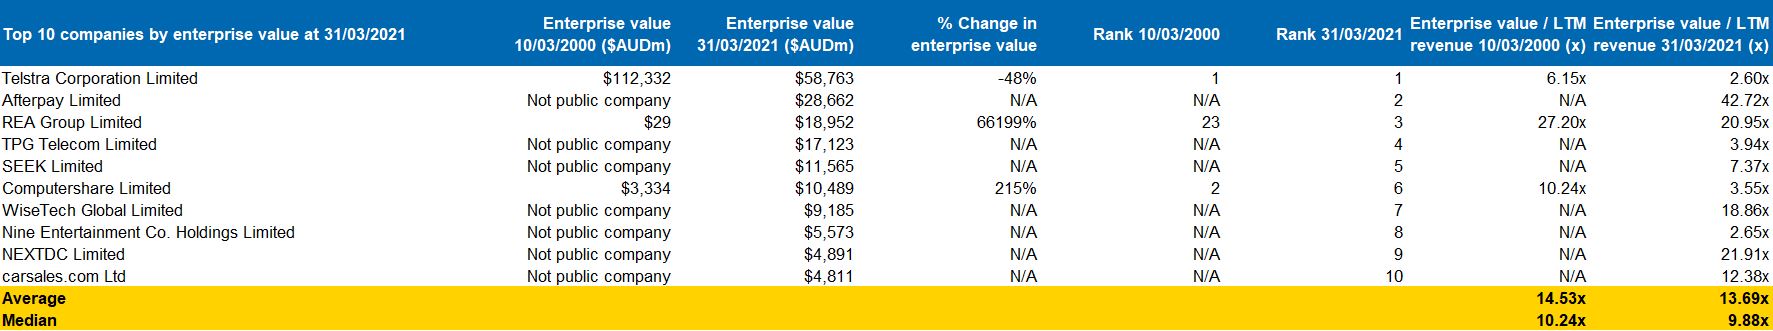
The story is not dissimilar in Australia. Of the top 10 Australian tech companies with the highest EVs at 10 March 2000, only two of them remained on the top 10 list 21 years later at 31 March 2021. Those companies are Telstra and Computershare. Telstra held top spot on the list at the height of the tech bubble and was able to maintain that position to also hold it at 31 March 2021.


The median EV/R multiple of all companies in the Sector (Aus only) was 6.2x at 10 March 2000 compared to 5.5x at 31 March 2021. However, there is a major difference between the US and Australia. In Australia, the EV/R multiples of the top 10 companies in the Sector with the highest EVs at 31 March 2021 are much higher than the EV/R multiples of the top 10 companies in the Sector with the highest EVs at 10 March 2000.
Companies such as Afterpay (42.7x), NEXTDC (21.9x) and Wisetech (18.9x), which were not around at the time of the tech bubble, are trading at tremendous EV/R multiples, indicating that the market expects these companies to stay at the forefront of the Sector.
We note that there are also many more companies on the ASX in the Sector in 2021 compared with 2000. Whilst the median EV/R multiple of the companies in the Sector (Aus only) is slightly lower at 31 March 2021 compared to 10 March 2000, the median EV levels are much lower, indicating much lower revenue levels too. So, the tech Sector in Australia seems to be as hot (or even hotter) than it is in the US.
| Aus Technology companies | 10/03/2000 | 31/03/2021 |
| Number of companies | 31 | 209 |
| Median enterprise value ($AUDm) | $137 | $76 |
| Median EV / LTM revenue multiple (x) | 6.15x | 5.47x |
Nevertheless, median EV/R multiples both in Australia and the US are still lower than they were at the height of the tech bubble, when Australian tech companies were trading at a median EV/R multiple of 6.1x and US tech companies at a median EV/R multiple of 4.8x. Furthermore, given risk-free interest rates in Australia in at the height of the tech bubble were sitting around 5.5%, this would most likely put valuations of tech companies way ahead of where they are today on a risk-adjusted basis.
The IPO market
The IPO market has been hot as well, across all sectors. In the 12 months to 31 March 2021, there were 2,360 IPOs around the globe, 917 of which were listed on the major US exchanges and the ASX. Of these 917 IPOs, approximately 1/8 were in the tech Sector. Since listing, many of these companies have achieved excellent returns for their shareholders. The median share price increase from listing to 31 March 2021 was 18%.
| Biggest IPOs | $AUDm |
| Snowflake Inc. | 4,605 |
| DoorDash, Inc. | 4,540 |
| KE Holding Inc. | 2,957 |
| Bumble Inc. | 2,781 |
| Warner Music Group Corp. | 2,772 |
| Best performing IPOs | % Increase |
| Fathom Holdings Inc. | 243% |
| Shift 4 Payments, Inc. | 225% |
| Yalla Group Limited | 212% |
| Pentanet Limited | 206% |
| Flux Power Holdings, Inc. | 205% |
Rational investing
So, are investors acting rationally by continuing to buy shares in tech companies where valuations in the Sector are close to, and in some cases higher than, where they were at the peak of the tech bubble? A rational investor would look for companies that can generate long-term profits and cash flows into the future with minimal risk. To do this you generally need to have a strong competitive advantage and maintain a clear market-leading strategy. However, it is difficult to maintain competitive advantages in the tech sector as there are continually new market entrants that are looking to do things bigger, better and faster.
Competitive advantages and the current tech landscape
A good example of a tech business that has been able to build and maintain a competitive advantage is Google (or Alphabet as it is referred to in the table above), which sits at #3 on our list of the top 20 US companies in the Sector with the highest EVs at 31 March 2021. Google has been able to build a product/brand that is used/recognised by many people around the world, making it difficult for new players to enter the market. Despite this, Google and other highly successful tech companies that have strong competitive advantages appear to be the exception, not the rule.
That said, it is worth noting that the tech landscape has changed significantly since 2000, with technology becoming a big part of our daily lives today. We read e-books. We read the news on our phones, tablets or laptops. We purchase clothes, electronics and furniture online. Board meetings are now conducted in private Zoom meetings. Technology has been inextricably woven into our daily routines. We also live in a world of record low interest rates, which has inflated asset valuations. However, as the global economy recovers from the COVID-19 pandemic on the back of unprecedented monetary and fiscal policy, there is a risk that rising interest rates could depress asset valuations and trading multiples.
When interest rates are increased, the tech companies with strong competitive advantages should be able to maintain strong valuations. However, at the more speculative end of the Sector, those tech businesses without a compelling business case could struggle to deal with the higher cost of capital, driven by higher interest rates.
What’s behind the rising estimates?
Since the tech boom in 2000, businesses have also adopted new business models, such as Software-as-a-Service (“SaaS”),where software is licensed on a subscription basis and is centrally hosted. The underlying fundamentals of a SaaS model is the potential to significantly increase the size of the addressable market, the ability to scale quickly and with minimal cost of goods sold. In our experience working with private businesses that provide SaaS products, investors have been willing to invest in SaaS businesses at high valuation multiples for some time.
While the underlying fundamentals of SaaS businesses are strong, the number of companies providing such business models is growing. The high number of new entrants to the sector is likely to provide a challenge to businesses in the Sector that are seeking to maintain and grow their market positions.
History would indicate that there is likely to be movement in the companies that populate the list of top 20 tech companies with the highest EVs across time. In 2021, the likes of Facebook, Netflix and Visa have overtaken companies such as Vodafone, Nokia and Orange, all of which occupied a place in the top 20 in March 2000. Which companies will be there in 2022, 2025 or 2030? I don’t know.
Advice for investors
What I can tell you, is that before investing in a technology company it is important to come back to basic valuation fundamentals. Those companies in the Sector that have strong competitive advantages and can grow their cash flows and earnings in the long-term can most likely justify their current valuation multiples and deliver solid returns for investors.
Note: All multiples have been sourced from S&P Capital IQ.