International equities
International equities in February faced a complex environment of policy uncertainty and heightened geopolitical developments. March saw these developments escalate further.
The US Federal Reserve did not meet last month and will next meet on 16 to 17 March. By the end of February, market pricing suggested investors anticipated two further Fed rate cuts this year, with the first fully priced for July. Economic data during the month was mixed but broadly consistent with a resilient US economy. Closely watched non-farm payrolls data exceeded expectations, while low layoffs helped keep the unemployment rate lower than otherwise would have been the case.
Legal institutions injected fresh policy uncertainty into the US after the Supreme Court ruled that the President could not use the International Emergency Economic Powers Act to impose broad reciprocal tariffs. In response, President Trump announced new global tariffs under Section 122 of the Trade Act and initiated new Section 301 trade investigations to maintain pressure on trading partners.
At the same time, tensions between the US and Iran intensified, keeping geopolitical risks elevated through the month. Geopolitical risks rose further after markets closed in late February, as military developments involving the US, Israel and Iran emerged. Not surprisingly, March opened with sharp market moves, particularly in energy markets.
Japan was the best performing major share market in February, as measured by the Nikkei 225 index. The snap election victory of Prime Minister Sanae Takaichi delivered the largest majority since World War II. Her government has promised increased fiscal spending, supporting equities, although concerns around fiscal sustainability are also rising.
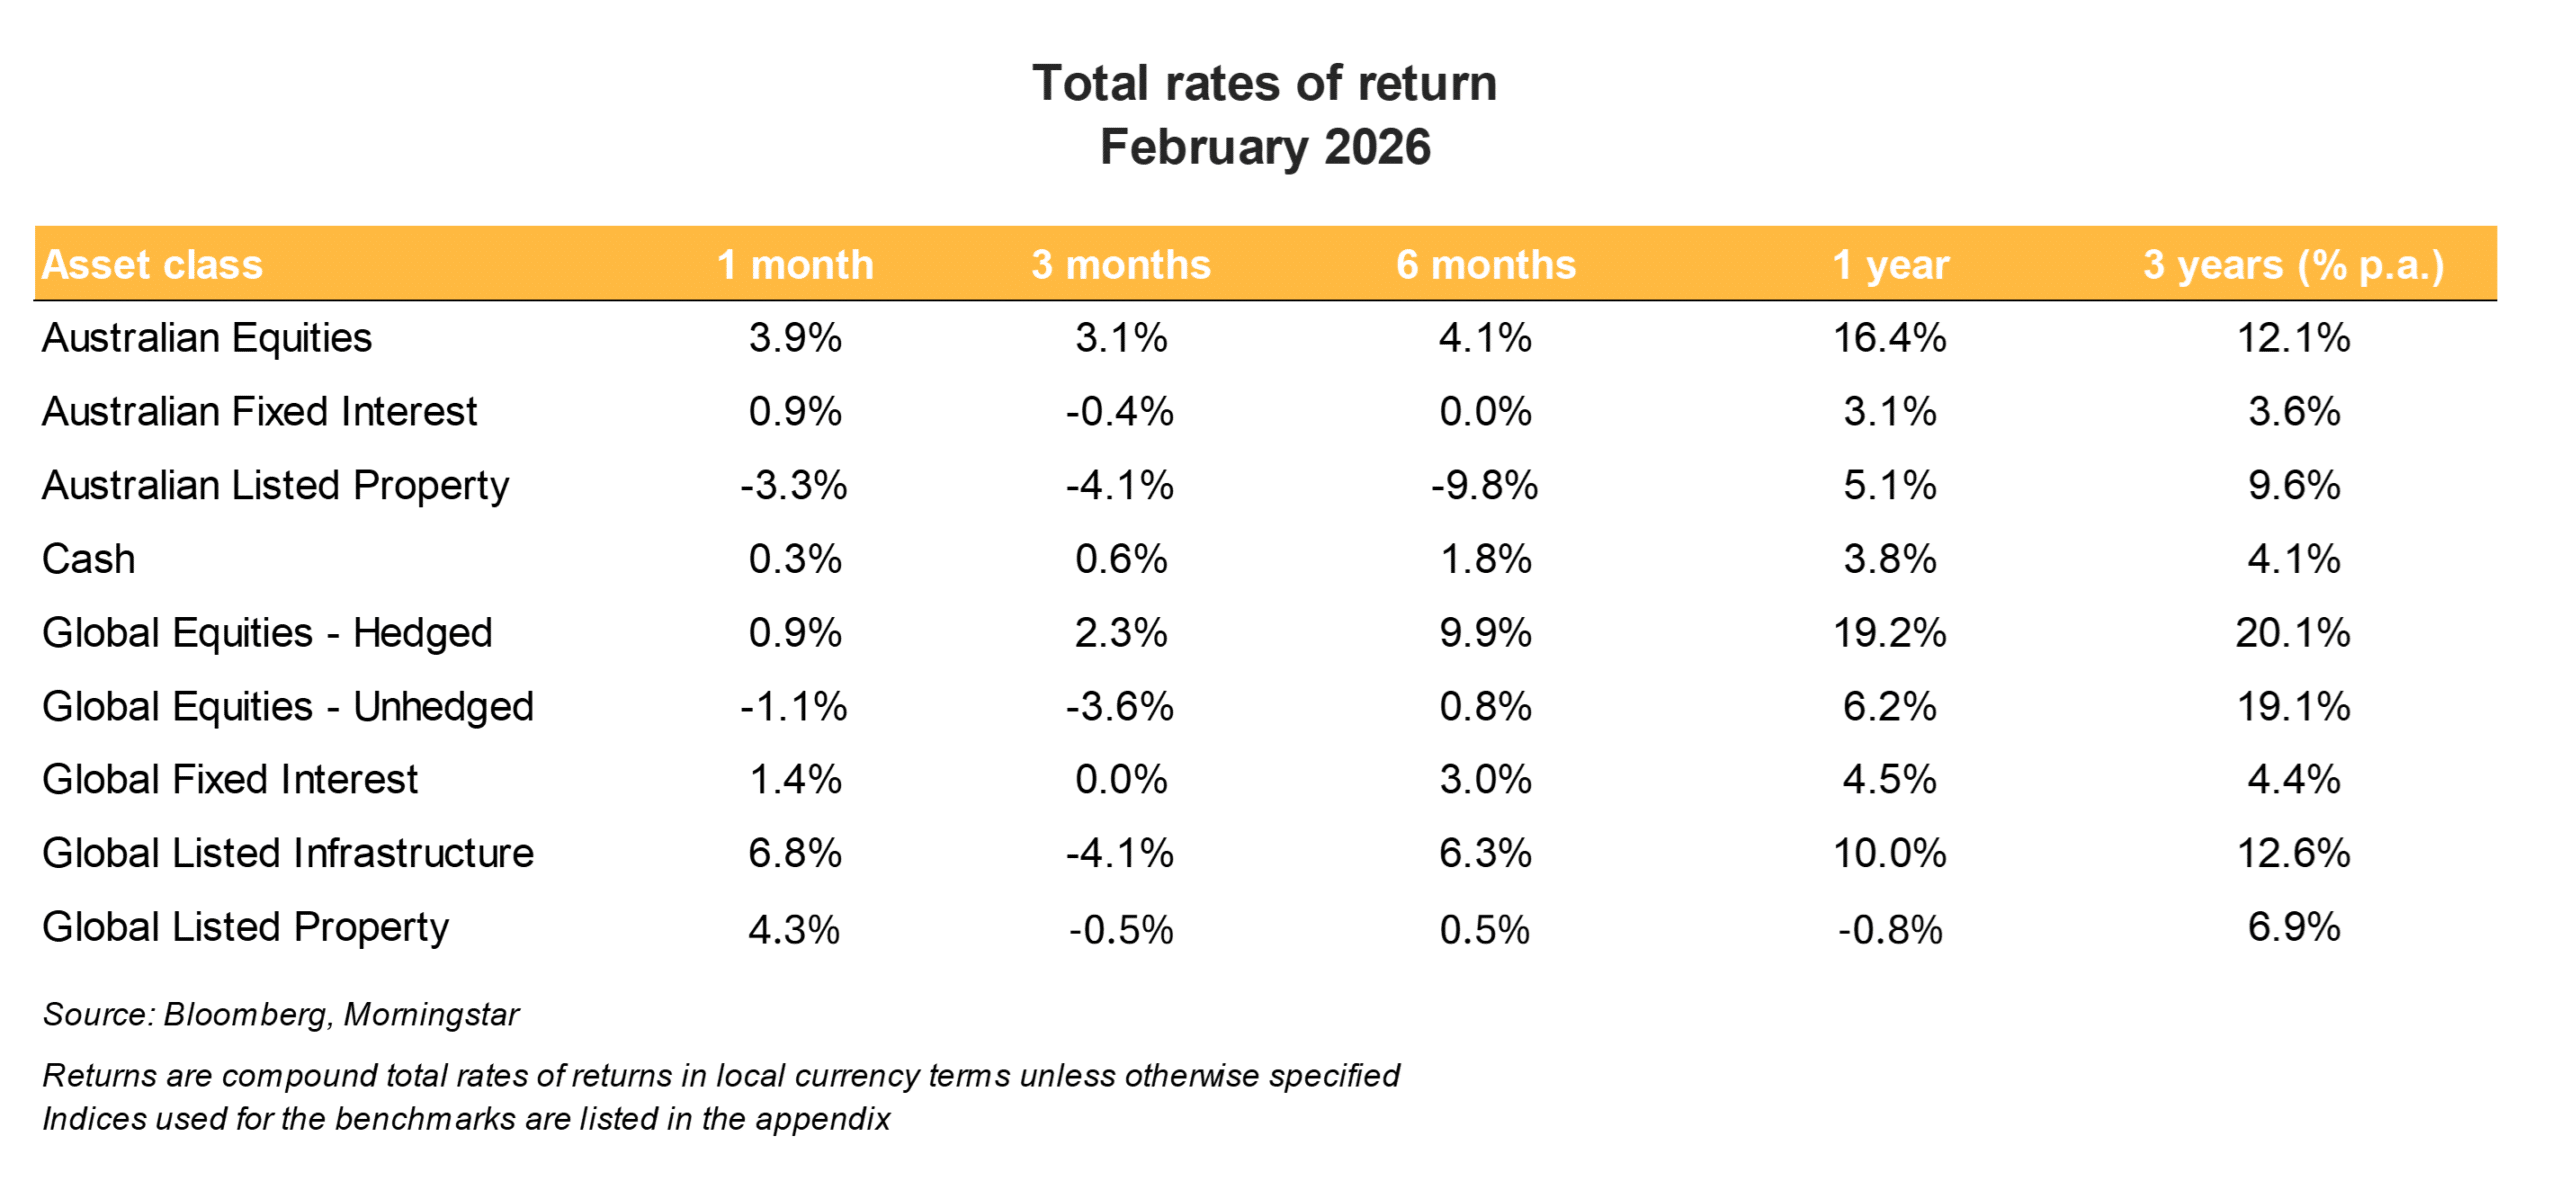
The Australian share market returned a solid 3.9% in February, while US markets underperformed amid volatility in the technology sector. Investors continued rotating away from large US technology stocks, despite a strong earnings season. Concerns persist around the scale and durability of capital spending linked to artificial intelligence.
Value stocks outperformed growth stocks during the month, returning 5.5% compared with 0.8%. Emerging markets also outperformed developed markets, returning 3.0% versus a fall of 1.6%, extending a theme evident in January.

|

|
Australian equities
Australian equities delivered a solid return of 3.9% in February, following a 1.7% gain in January, despite the Reserve Bank of Australia (RBA) raising the cash rate during the month. Over the year to the end of February, the S&P/ASX 300 index has delivered a total return of 16.4%. That is stronger than the average annual return of 12.4% over the past three years.
The materials sector has been a consistent outperformer in recent months and remained a key contributor in February. Financials were the strongest performing sector during the month, supported by favourable bank earnings results that underpinned share prices. Materials followed closely and, over the year to date, remains the leading sector, well ahead of other areas of the market.
By contrast, health care and information technology continued to lag. Health care was weighed down by ongoing weakness in CSL with sentiment further affected by the unexpected departure of its chief executive. The IT sector also continued to contract, reflecting the broader global rotation away from technology stocks.
The Australian dollar rose 2.2% against the US dollar in February, reaching a high of US$0.7147 on 12 February, its highest level in around two years. The stronger currency weighed on returns for some large listed companies with significant offshore earnings exposure.

|

|
Fixed income and currencies
Bonds delivered positive returns in February, both globally and domestically. Australian fixed interest returned 0.9% while global fixed interest returned 1.4%. Rising geopolitical risks toward the end of February prompted a shift into safer haven assets, supporting demand for government bonds.
Across major economies, government bond yields fell in February, as demand for bonds pushed up prices. In Australia, 2‑year yields declined by two basis points and 10‑year yields fell by 16 basis points. The 2-10‑year spread narrowed from 67 basis points at the end of January to 47 basis points by the end of February. In the US, 2‑year yields fell by 15 basis points and 10‑year yields declined by 33 basis points, with the 2-10‑year curve flattening from 49 basis points to 31 basis points over the month.
Private credit markets have come under the spotlight. Returns are under pressure as spreads have tightened and competition has increased. There has also been collateral damage to private credit from the decline in technology stocks, given that private credit exposure to the software sector is estimated at around 20%. Software firms have long been attractive targets for private lenders because their subscription-based business models generate relatively predictable cash flows that can support higher levels of borrowing.
Investment grade spreads also widened locally and globally. The Australian 5-year iTraxx investment grade spread widened 5 basis points while the US investment-grade 5-year and 10-yuear spreads each widened by close to 7 basis points during the month.
The Australian dollar (AUD) was initially supported in early February by a widening in Australian‑US interest‑rate differentials, as the RBA diverged from the US Federal Reserve. Following the RBA rate increase on 3 February, the Australian-US cash‑rate differential shifted from minus 15 basis points to plus 10 basis points, helping propel the AUD/USD to a 2-year high of 0.7147 on 12 February. The AUD/USD ended February near this high, at 0.7118. But as the Middle-East conflict began and deepened, the AUD sold off against the USD. In trade‑weighted terms, the Australian dollar was 1.6% firmer.
The US dollar index strengthened over February, rising from 96.99 at the end of January to 97.61 by the end of February. One of the largest moves was against the Japanese yen, which weakened by 0.8% against the US dollar during the month.


Property and infrastructure
Australian listed property (in unhedged AUD terms) recorded a negative return of 3.3% last month. Global listed property and infrastructure, on the other hand, recorded firm gains of 4.3% and 6.8%, respectively last month. Outside of equities, over a longer time frame, global listed infrastructure has delivered solid returns. The growing demand for renewable energy, power networks and digital infrastructure have continued to provide support to global infrastructure.
Outlook
Geopolitical risks rose sharply after markets closed for February, following the escalation of conflict in the Middle East from 28 February. Early hopes that leadership change in Iran might deliver a swift resolution proved unfounded. Iran’s political system is deeply institutionalised, making it harder to produce a regime change in the same way as for some other countries like Syria and Iraq. The conflict has since broadened with Iran targeting US interests and facilities across the Gulf, drawing more countries into the confrontation and raising the risk of sustained disruption to global energy markets.
The most immediate market impact has been felt through oil. The effective closure of the Strait of Hormuz represents a major supply shock, given its role as a conduit for roughly 20% of global crude oil and liquefied natural gas flows. Disruptions to Iranian exports, alongside shutdowns and production curbs across neighbouring Gulf producers has triggered an abrupt surge in oil prices. Brent crude futures briefly traded near US$120 per barrel on 9 March, its highest level since 2022, before retracing some of those gains as the leaders of the Group-of-Seven (G7) nations moved to reassure markets.
Coordinated signals from G7 nations that they are prepared to support energy supply, including through the release of strategic reserves, helped stabilise prices. The US administration has also flagged measures aimed at keeping oil moving through the Strait, including insurance guarantees and safe‑passage arrangements for including military escorts where needed. These steps reduced immediate fears of a prolonged supply squeeze, although how quickly these measures can be deployed and how successful they are remains to be seen. Even so, oil markets remain highly sensitive to developments and volatility is likely to persist until there is greater clarity on the duration and scope of the conflict.
Beyond energy, the implications for inflation warrant close attention. The Strait of Hormuz is also critical to the global fertiliser trade, raising the risk of higher agricultural costs and renewed pressure on food prices.
Central banks typically look through temporary price shocks, but the longer disruptions persist, the greater the risk that inflation expectations begin to move higher.
In Australia, the conflict strengthens the case for further policy tightening in the near term. We continue to expect another rate increase from the RBA, most likely in May, though a March move cannot be ruled out. Higher fuel costs will add to near‑term inflation pressures, even as they weigh on household spending. This tension reinforces the importance of carefully balancing inflation control with growth risks.
Financial markets have responded swiftly. Riskier asset classes, such as equities, have come under selling pressure and volatility has spiked. The VIX volatility index on 9 March moved to 35.3, its highest level since early 2025 before unwinding some of this spike. It highlights how quickly sentiment can shift.


Sector performance in share markets and in the economy are likely to diverge with energy and materials benefiting from higher commodity prices, while more cyclical and interest‑rate‑sensitive sectors are likely to lag. Those sectors that are more energy intensive are also likely to lag.
History offers valuable perspective for investors. Geopolitical shocks have typically had a limited and temporary impact on markets unless they evolve into a broader economic crisis. Markets can recover quickly, provided growth, fiscal policy and monetary settings remain supportive. That said, there are notable exceptions. Prolonged energy shocks, such as those seen in the 1970s, demonstrate how geopolitical events can inflict lasting economic damage when supply disruptions persist.
A key question for investors is whether this conflict becomes one of those exceptions. That will hinge on whether disruptions to oil and gas supplies endure long enough to materially impair growth and add to inflation.
The breadth of the conflict and the strategic importance of the Strait of Hormuz argue for a more disciplined approach to portfolio-asset-allocation strategies. Diversification becomes more valuable when volatility rises. Government bonds and high-quality credit have reasserted their role as portfolio stabilisers. Indeed, high-quality fixed income assets provides income and downside protection should growth disappoint.
Within risk assets, positioning should favour balance over a full retreat. In particular, elevated equity valuations and greater sensitivity to policy and geopolitical shocks reinforce the case for diversification across regions and sectors, rather than concentrated exposures. Maintaining liquidity and flexibility is important, as markets are likely to remain highly responsive to headlines and shifts in central-bank expectations. In environments like this, patience and diversification matter more than attempting to time market moves precisely.
Disclaimer
This report has been prepared for general informational purposes only and does not constitute personal financial advice. It does not take into account your specific objectives, financial situation, or needs. Before acting on any information in this report, you should consider its appropriateness in light of your circumstances and seek independent financial advice. The author holds, or may hold, positions in some of the securities mentioned in this report. These holdings may represent a potential conflict of interest. No representation or warranty is made as to the accuracy, completeness, or reliability of the information contained herein. Past performance is not a reliable indicator of future performance.