Australian activity
Aggregate value and number of transactions in Australia (2016-1H2025)

Breakdown of M&A activity per transaction size category in Australia (2016-1H2025) (% of total # of transactions)
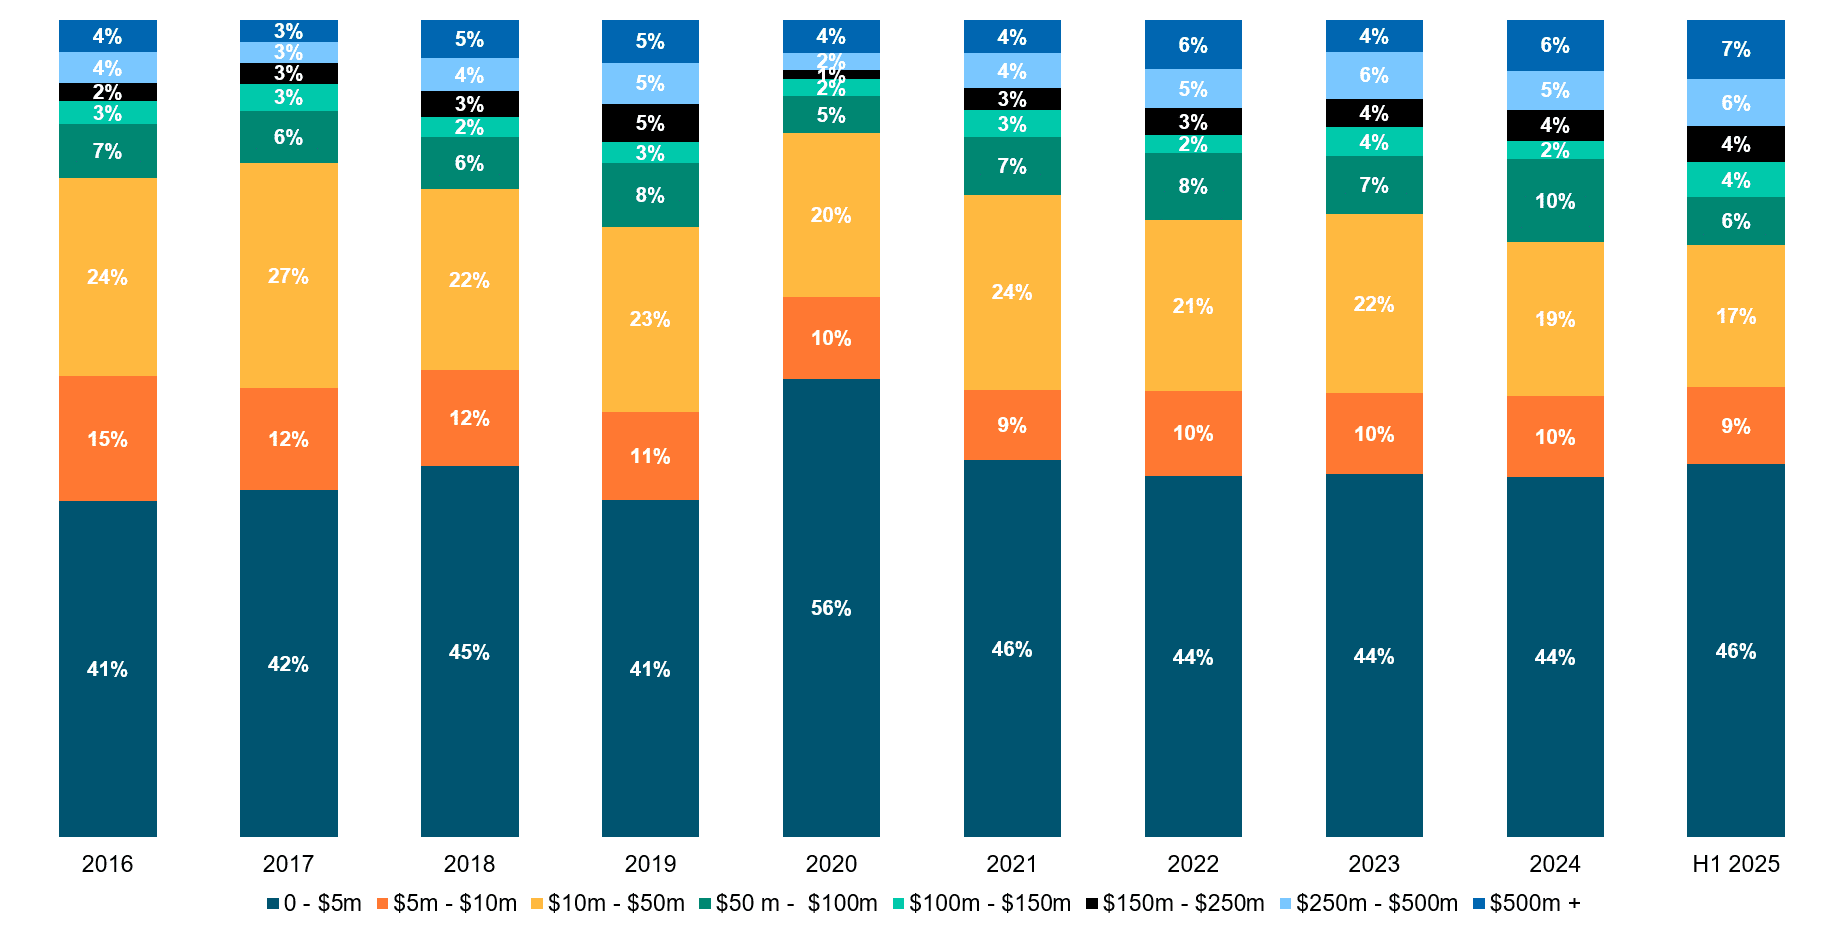
While Australian M&A activity dropped to a decade low of just 268 deals, total deal values have stayed steady at around $22 billion over the past three years. Ongoing uncertainty has impacted confidence, however, solid valuations, strategic consolidation and global interest have helped support deal flow.
Breakdown of M&A activity by industry sector
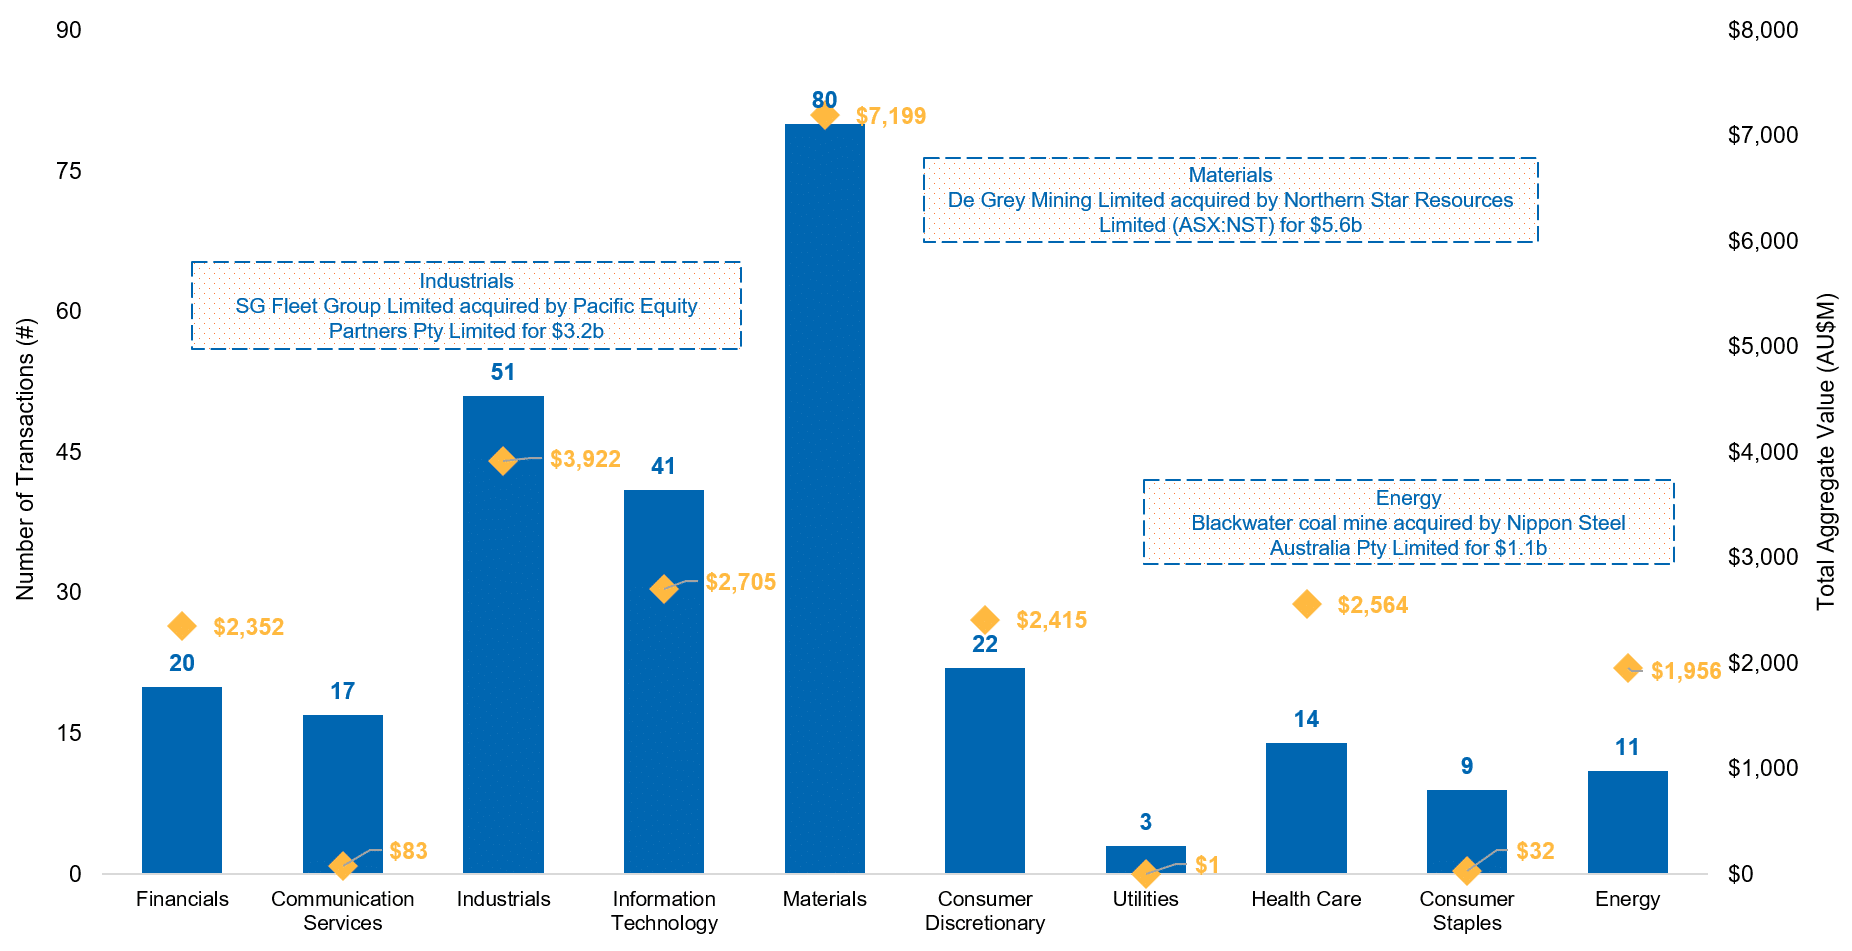
Businesses in the materials sector dominated M&A activity with 80 deals and $7.2b in disclosed aggregate deal value. Northern Star Resources Limited’s acquisition of De Grey Mining Ltd for $5.6b was a significant driver of this sector’s outperformance.
The industrials sector also outperformed, driven by Pacific Equity Partners Pty Ltd’s $3.2b acquisition of SG Fleet Group Ltd., representing PEP’s 10th take-private transaction, underscoring the nexus between private and public capital markets. SME industrials were also among the most active; GenusPlus Group acquired Partum Engineering and L&M Power Constructions and Simonds Group acquired Dennis Family Homes.
Global activity
First half global M&A activity (total transaction value, $t)
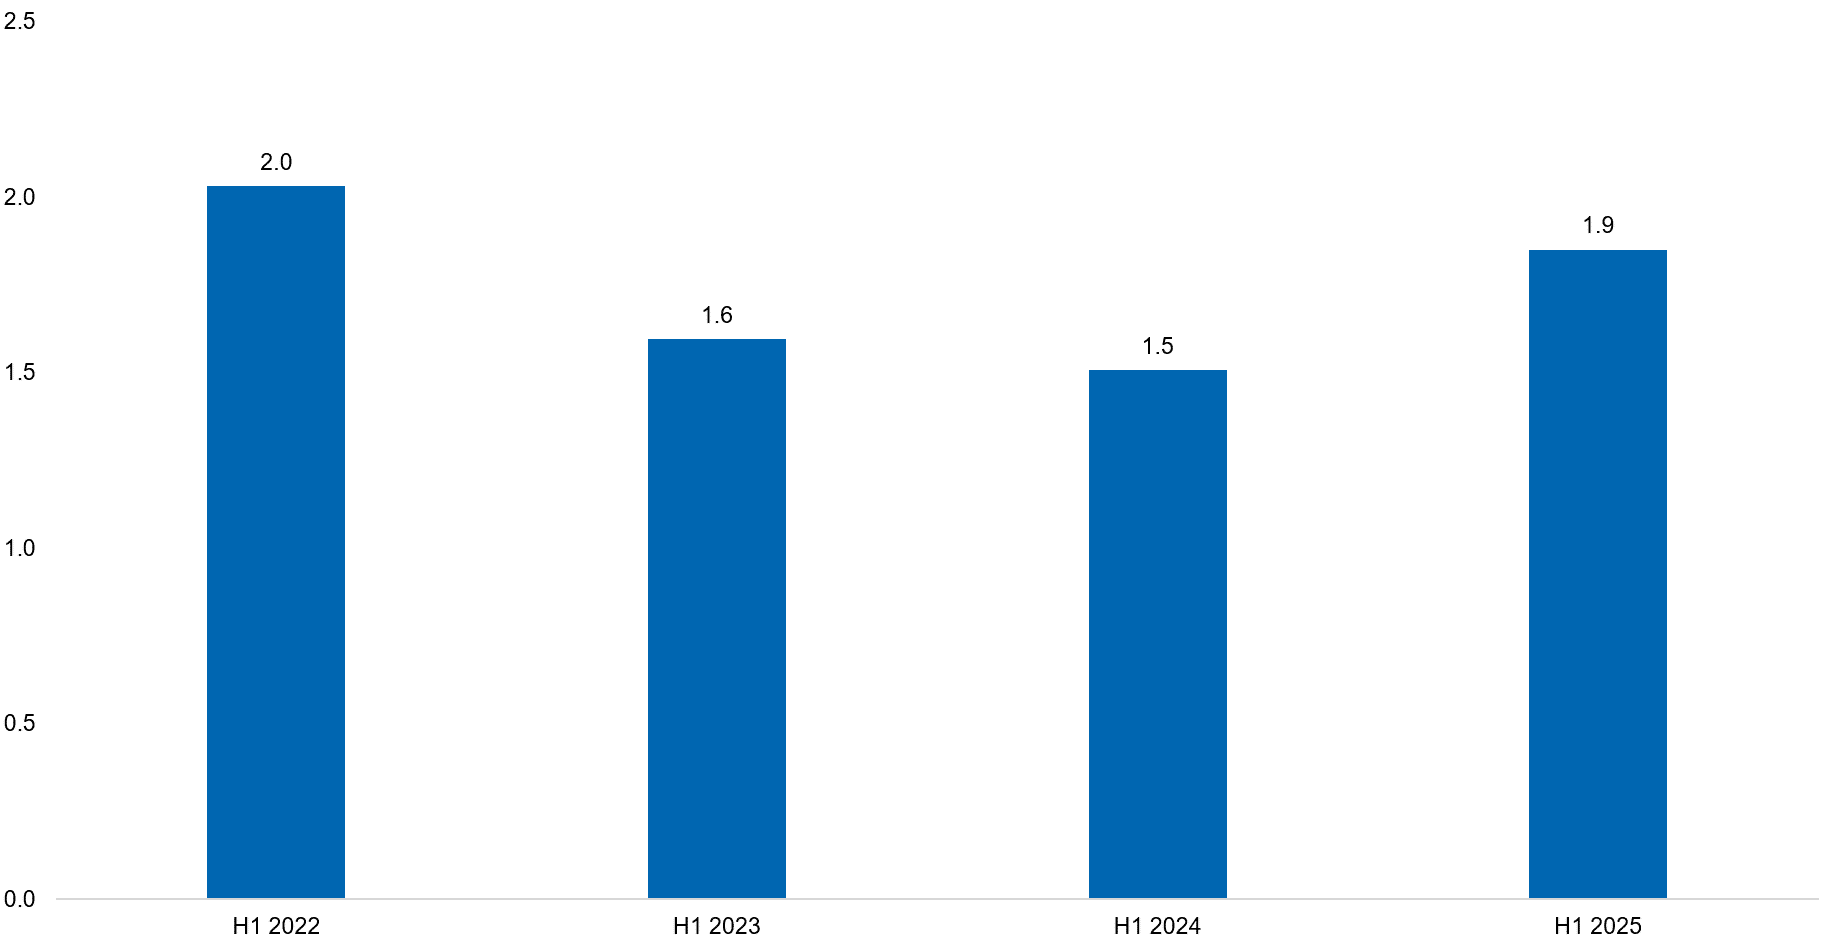
Global M&A activity has rebounded, compared to both H1 2023 and 2024. Transaction values were $1.9 trillion in H1 2025, an increase of 27% from the previous corresponding period (pcp). Higher value deals saw Europe grow from 22% to 25% pcp and Asia-Pacific expand from 13% to 20% pcp. Simultaneously, the United States saw a decline in activity by value from 61% of global market share to 52%, which is in line with its historical average. Part of this decline is explained by the uncertainty around the 2 April ‘Liberation Day’ tariffs, which likely stalled investment deal decisions.
Breakdown of global M&A activity by industry sector (% of total transaction value)
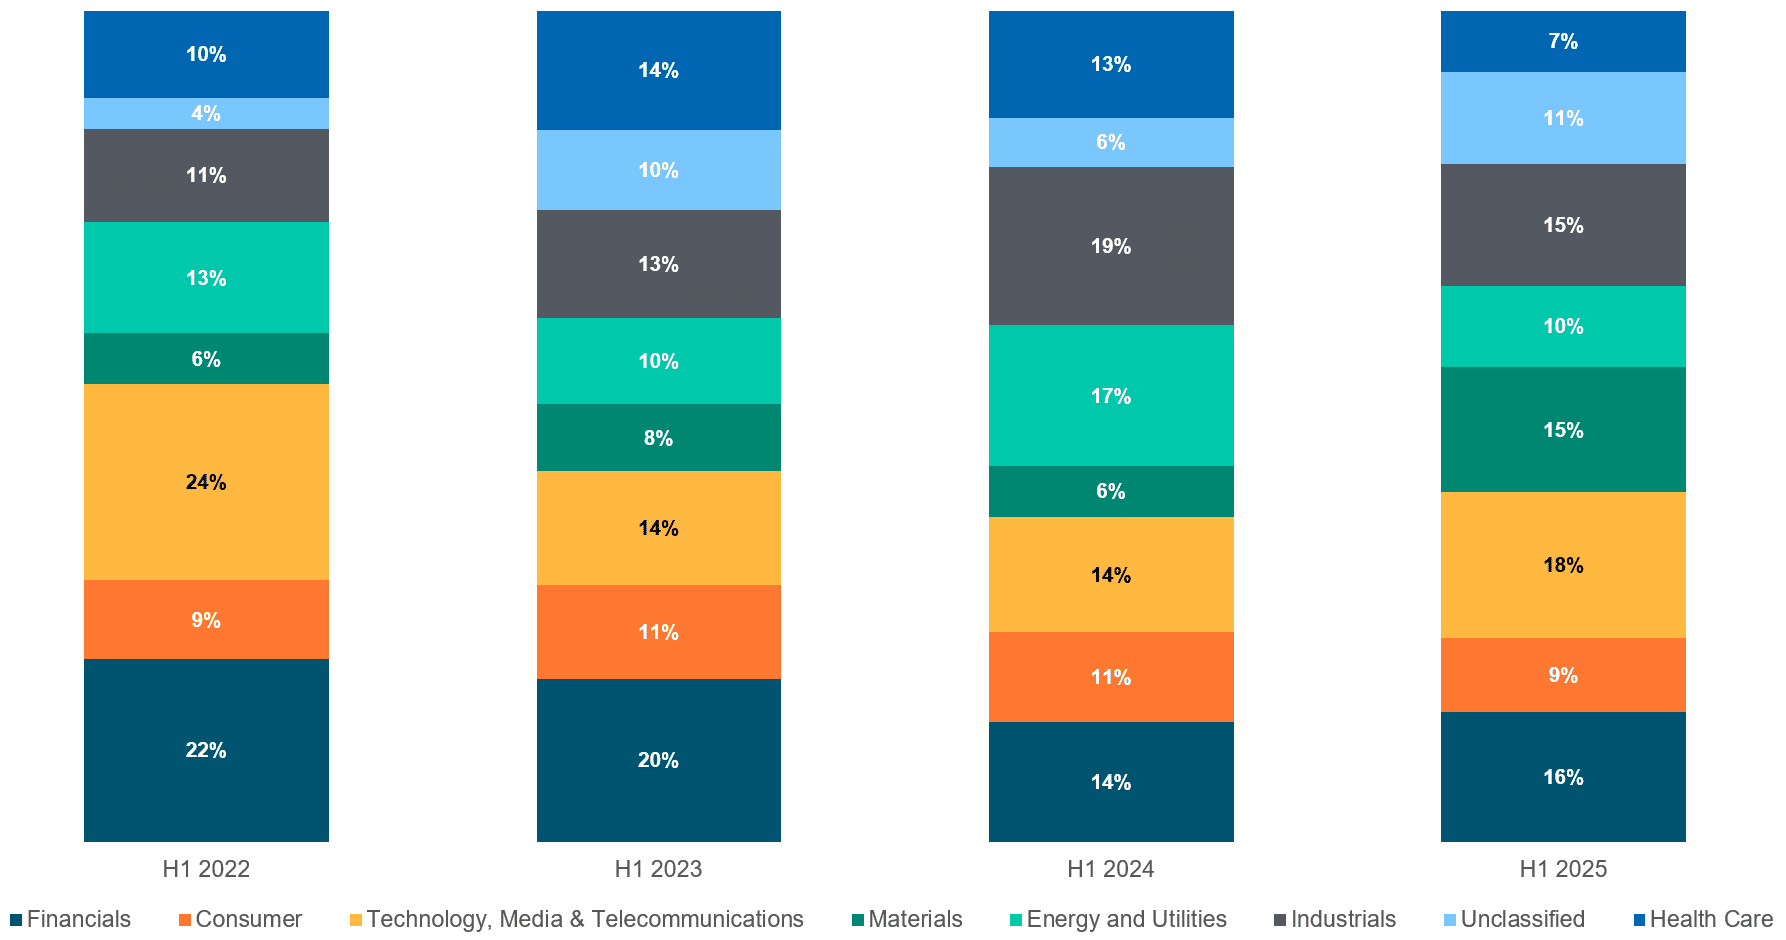
The Technology, Media and Telecom (TMT) sector has recorded a rebound in its share of transaction value, growing from 14% in H1 2023 and 2024 to 18% in H1 2025. In contrast, both Energy & Utilities and Industrials have seen a decline year-on-year from 17% to 10% and 19% to 15%, respectively.
This has been driven by the boom in AI and data centres, which has helped propel multiple expansions within the start-up ecosystem, with no sign of slowing. With the prospect of a further easing in monetary policy in Australia over the next year, we expect a further shift in investment away from ‘safer’ industrial and utilities industries to ‘riskier’ growth assets in technology.